Figure 7.
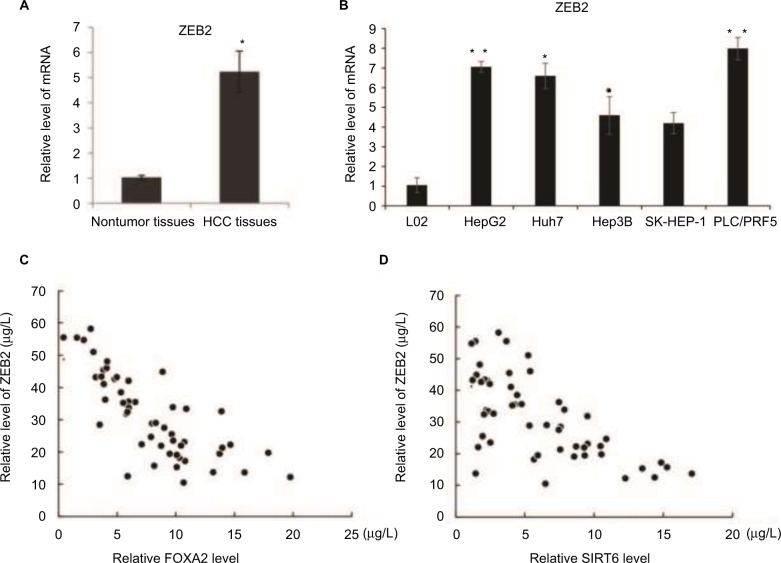
The negative correlation between the expression of ZEB2 and FOXA2 or SIRT6.
Notes: (A) mRNA level of ZEB2 was analyzed in the relative HCC tissues and adjacent noncancer tissues. (B) mRNA level of ZEB2 was analyzed in immortalized normal liver epithelial cells L02 and five HCC cell lines (HepG2, Huh7, Hep3B, SK-HEP-1, and PLC/PRF5). The data were represented as mean ± SD. *P<0.05, **P<0.01. (C) The correlation between the expression of FOXA2 and ZEB2 was measured in the HCC tissues. (D) The correlation between the expression of SIRT6 and ZEB2 was measured in the HCC tissues.
Abbreviations: CCK-8, cell counting kit-8; HCC, hepatocellular carcinoma; SIRT, sirtuin.

