Figure 2.

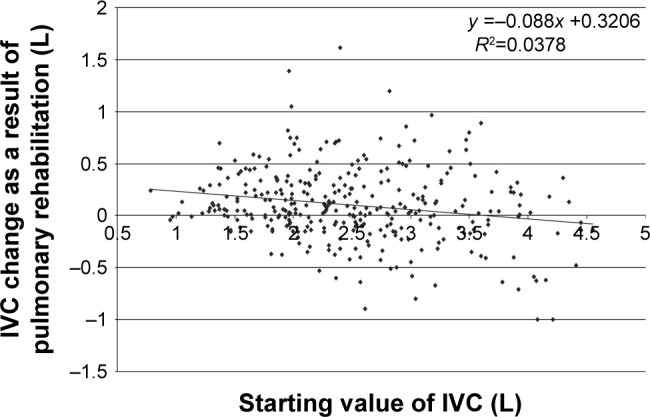
Scatterplot of inspiratory vital capacity (IVC) between the values at the start of rehabilitation and the change as an effect of rehabilitation.

Scatterplot of inspiratory vital capacity (IVC) between the values at the start of rehabilitation and the change as an effect of rehabilitation.