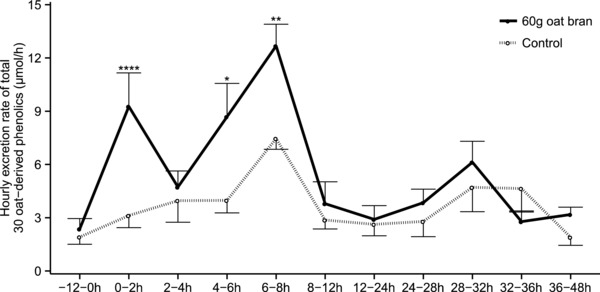
Figure 2.

Urinary excretion rate of total 30 oat bran‐derived phenolic compounds after intake of 60 g oat bran or a control meal in healthy men (μmol h−1). Data are reported as mean ± SEM and were analyzed by two‐factor repeated measurement linear mixed model with time and intervention as the two factors [significant effect of intervention (p = 0.005), time (p = 3×10⁻¹³), and time and intervention interaction (p = 5×10⁻⁶)]. Post‐hoc analysis with Tukey–Kramer adjustment was performed and p‐values are indicated as follow: * p < 0.05; ** p < 0.01; **** p < 0.0001.
