Figure 3.

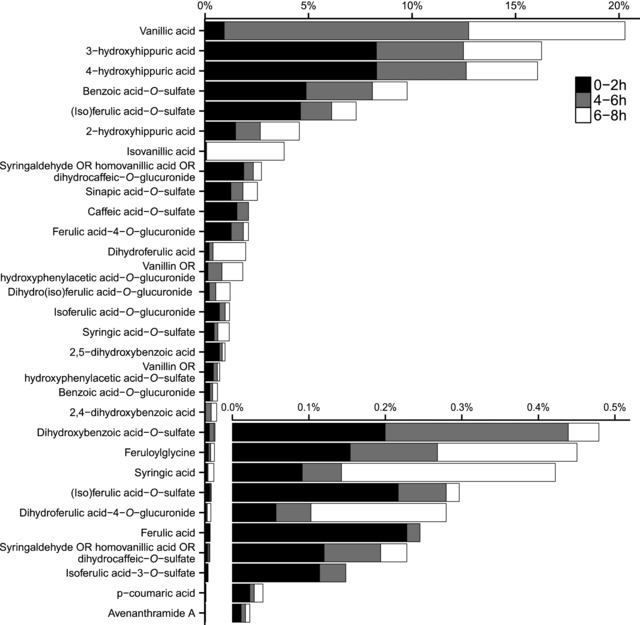
Proportions of individual oat bran‐derived phenolics relative to total excretion levels at 0–2 h, 4–6 h, and 6–8 h. Excretion level differences between the oat and control interventions were used to calculate percentages.

Proportions of individual oat bran‐derived phenolics relative to total excretion levels at 0–2 h, 4–6 h, and 6–8 h. Excretion level differences between the oat and control interventions were used to calculate percentages.