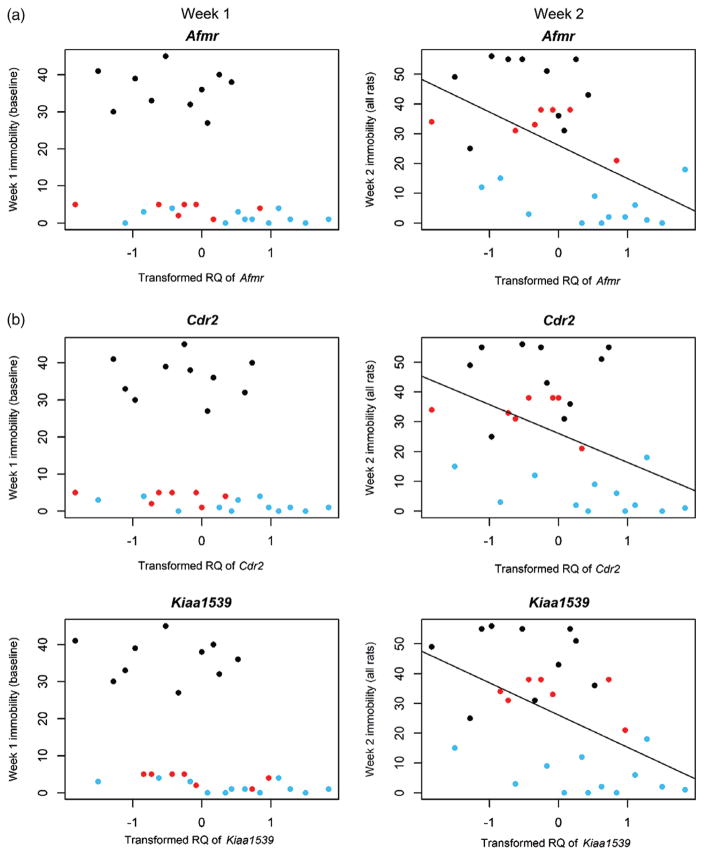
Figure 4. Scatter plots showing relationship between immobility score and normalized RQ levels of (a) Amfr, (b) Cdr2 and (c) Kiaa1539.
Data are shown for all animals during both week 1 and week 2. Animals are divided into three groups based on week 1 and week 2 immobility scores: low immobility both weeks (blue), high immobility both weeks (black), low immobility week 1 and moderate/high immobility week 2 (red). Results indicate that high RQ levels of Amfr and Cdr2 may predict which animals continue to have low immobility during week 2.

