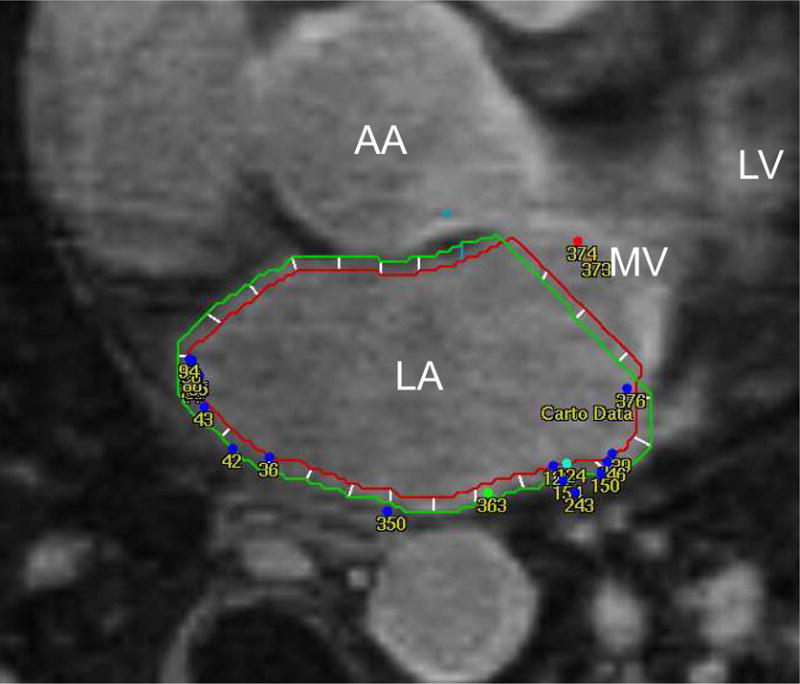
Figure 1.

Endo- and epicardial contours are manually drawn on axial LGE-MRI images. Fast-anatomical-mapping points are co-registered and projected to LGE-MRI. Bipolar voltage of each point is correlated to the image intensity ratio of the nearest segment. LA: left atrium; LGE-MRI: late gadolinium enhanced magnetic resonance imaging; MV: mitral valve; LV: left ventricle; AA: ascending aorta.
