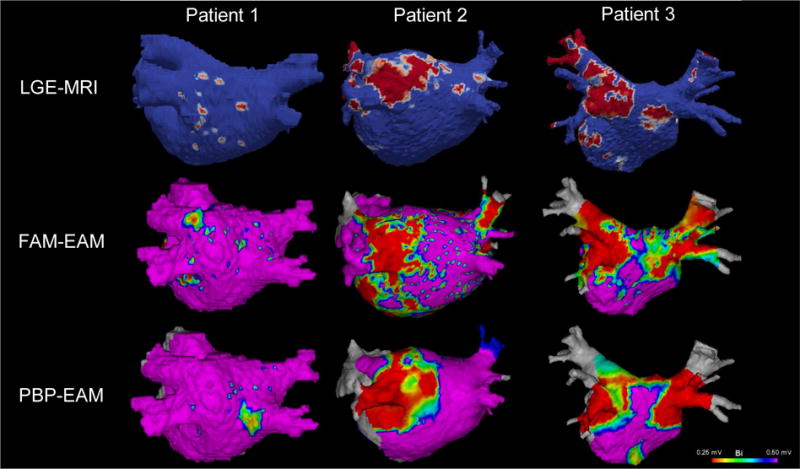
Figure 3.

This illustration compares IIR maps (Top Panel), FAM voltage maps (Middle Panel), and PBP voltage maps (Bottom Panel) in an ablation-naive patient with minimal baseline fibrosis (patient 1), an ablation-naïve patient with posterior wall fibrosis (patient 2), and a patient with a history of prior radiofrequency ablation for AF (patient 3). The figure demonstrates good correlation between the three mapping modalities. Of note, no voltage mapping was done in PV ostia and this area was excluded from any multimodal correlation analysis. Indeed, the thin myocardial sleeves in that area render voltage and MRI less suited for myocardial substrate mapping.
