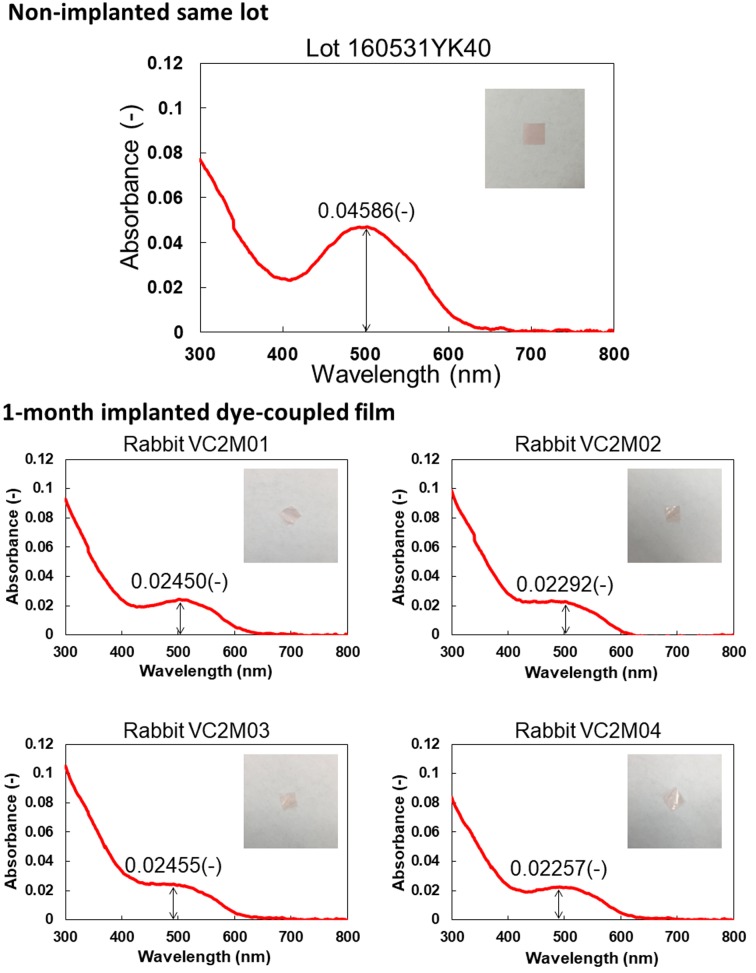
Fig. 3.
Spectrophotometric absorbance spectra (4 bottom panels) of 4 pieces of dye-coupled films which have been implanted for 1 month in subretinal space of rabbits’ eyes and removed by vitrectomy. Top panel shows absorbance spectrum of the non-implanted same lot. Insets are photographs of films. Values in each panel represent maximum absorbance around the wavelength of 500 nm.

