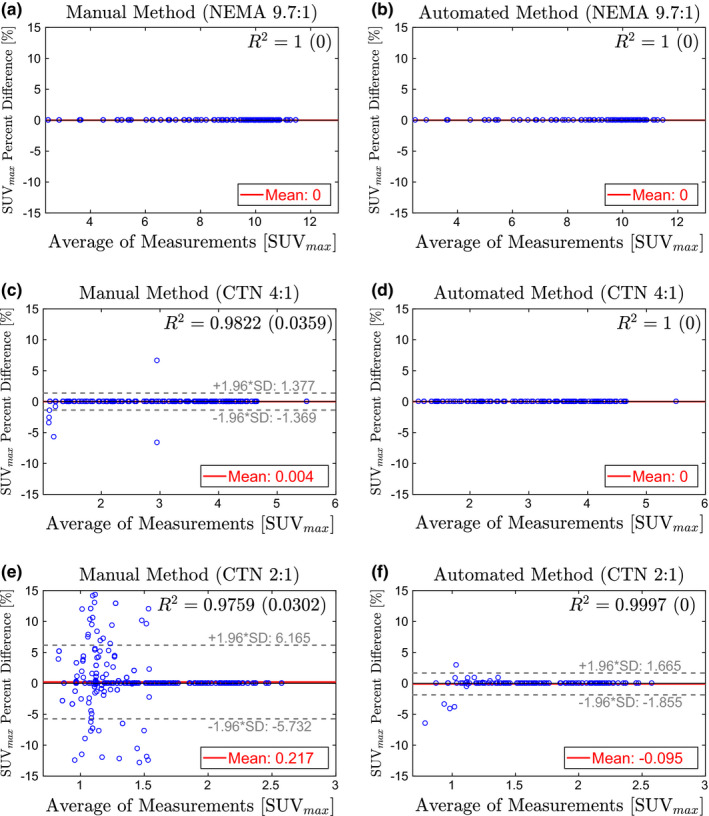
Figure 9.

Bland–Altman plots comparing SUV max from the manual method (left column) and automated method (right column) to the reference standard. Estimates for R 2 are given as the average of all trials with the standard deviation in parentheses. (a)–(b) NEMA phantom at 9.7:1 contrast. (c)–(d) CTN phantom at 4:1 contrast. (e)–(f) CTN phantom 2:1 contrast. [Color figure can be viewed at wileyonlinelibrary.com]
