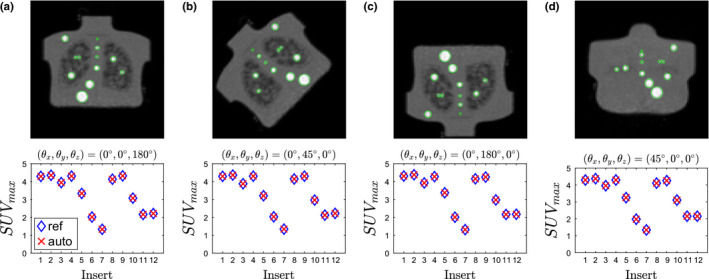
Figure 13.

Coronal maximum intensity projections of digitally transformed (rotated) phantom scans and corresponding analysis results. Images were transformed by rotating (a) 180∘ about the z–axis, (b) 45∘ about the y–axis, (c) 180∘ about the y–axis, (d) 45∘ about the x–axis. [Color figure can be viewed at wileyonlinelibrary.com]
