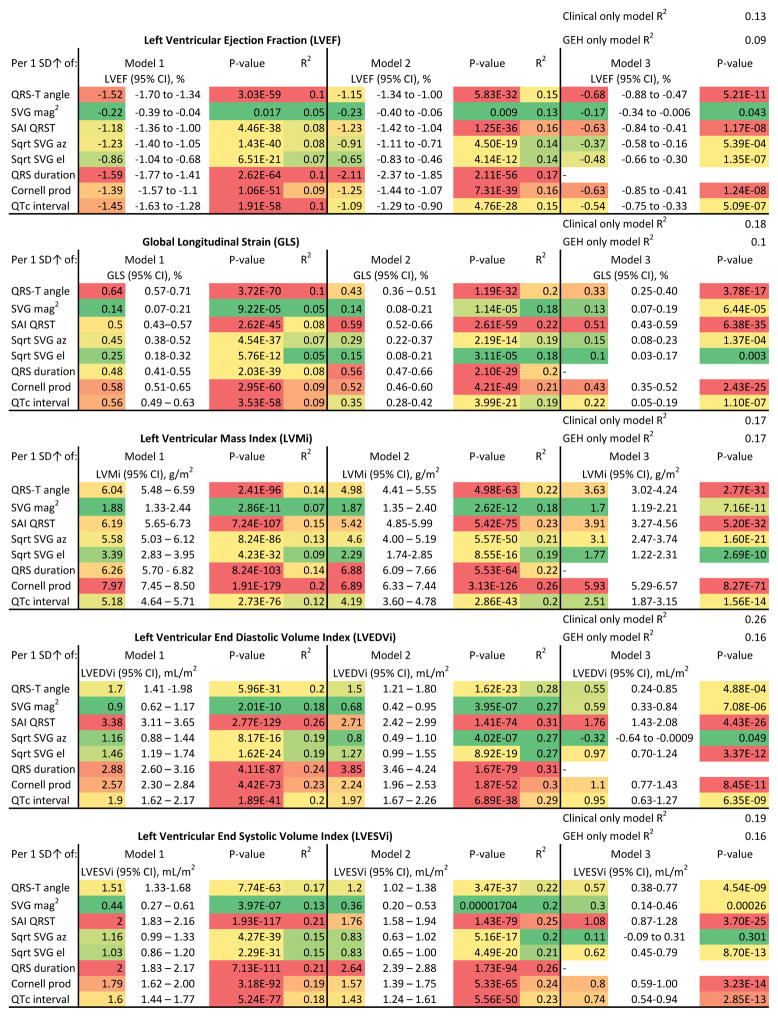
Figure 2. Cross-sectional difference (95% CI) in left ventricular structure and function indices per 1 SD of ECG metric increase.
Model 1 was adjusted for age, gender, and race. Model 2 was additionally adjusted for CHD, HF, hypertension, diabetes, BMI, smoking, presence of ventricular conduction abnormalities, as well as heart rate and systolic and diastolic blood pressure measured at the time of echocardiography. Model 3 in addition was adjusted for QRS duration. Heat map color coded the most significant findings (largest effect size and R2, and smallest P-value) as red. Color transitioned to the least significant findings (smallest effect size and R2, and the largest / less significant P-value) as green.

