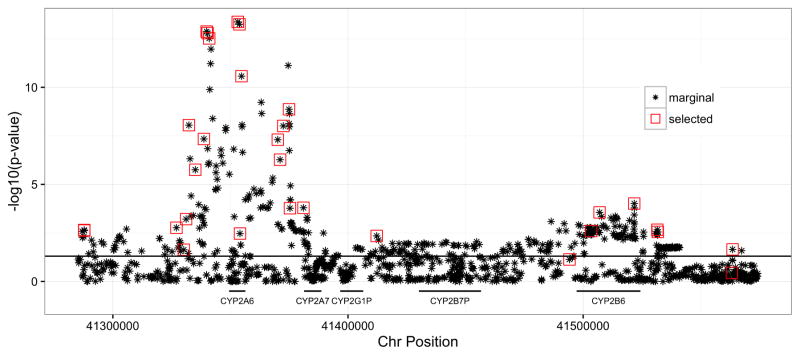
Figure 3. Genetic Associations with Nicotine Metabolism in the CYP2A6 Region of Human Chromosome 19.
The variants selected using penalized regression algorithms are overlaid on the marginal genetic association results (−log10 p-values on the y-axis). This shows how penalized regression algorithms can define biosignatures (red boxes) from complex patterns of marginal associations (stars).

