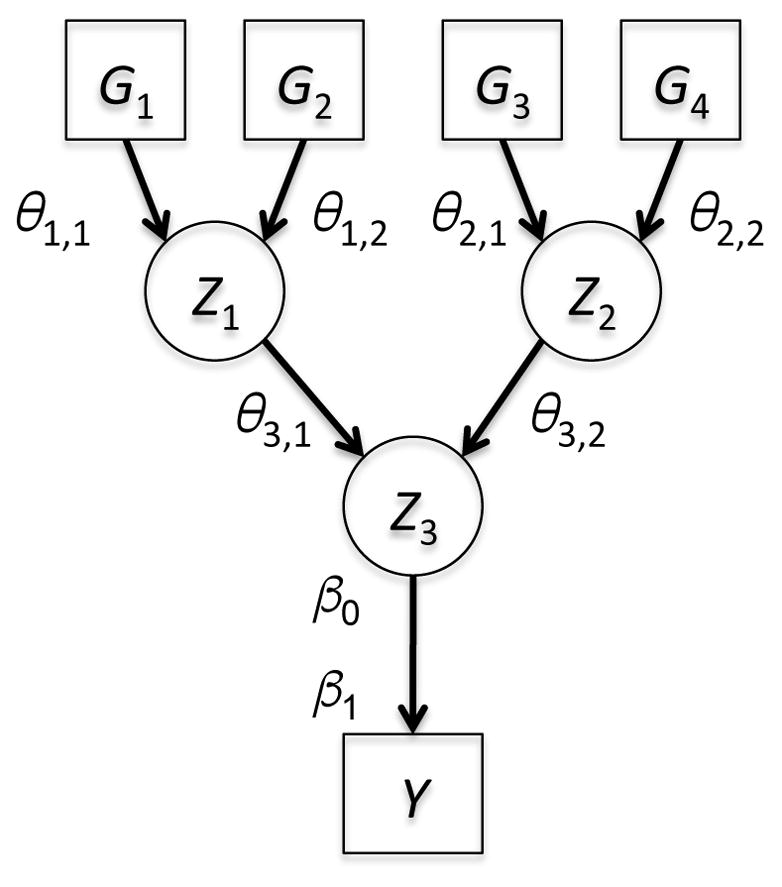
Figure 5. Tree-based Structures Can Represent Complex Relationships in Sets of Variables.

Here each derived variable Z is computed from its inputs (genetic variants, clinical factors, or other derived variables) and a pair of edge parameters θ. The regression coefficient β1 represents the net effect of the entire combination of variables on the outcome of interest Y. These structures were explored using Bayesian algorithms to learn biosignatures of nicotine metabolism.
