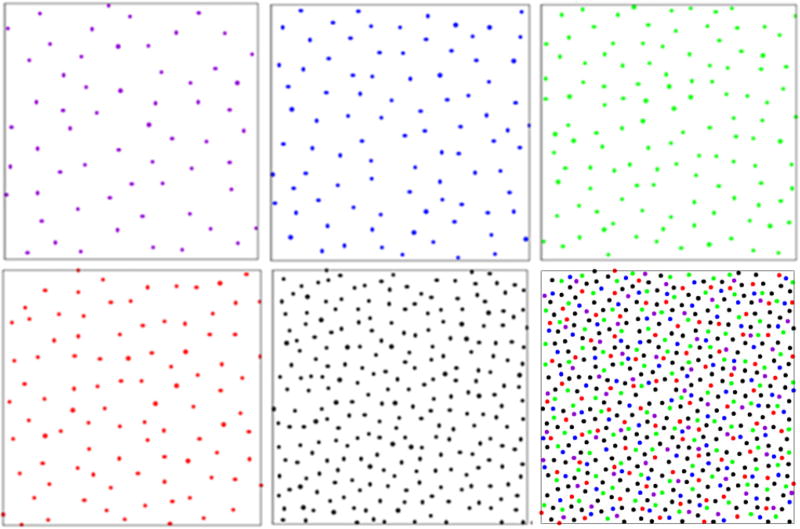
FIG. 8.
(Color online) Simulated point configurations representing the spatial arrangements of chicken cone photoreceptors. Upper panels: The configurations shown from left to right, respectively, correspond to violet, blue, and green species. Lower panels: The configurations shown from left to right, respectively, correspond to red, double species, and the overall pattern. The simulated patterns for individual photoreceptor species are virtually indistinguishable from the actual patterns obtained from experimental measurements.

