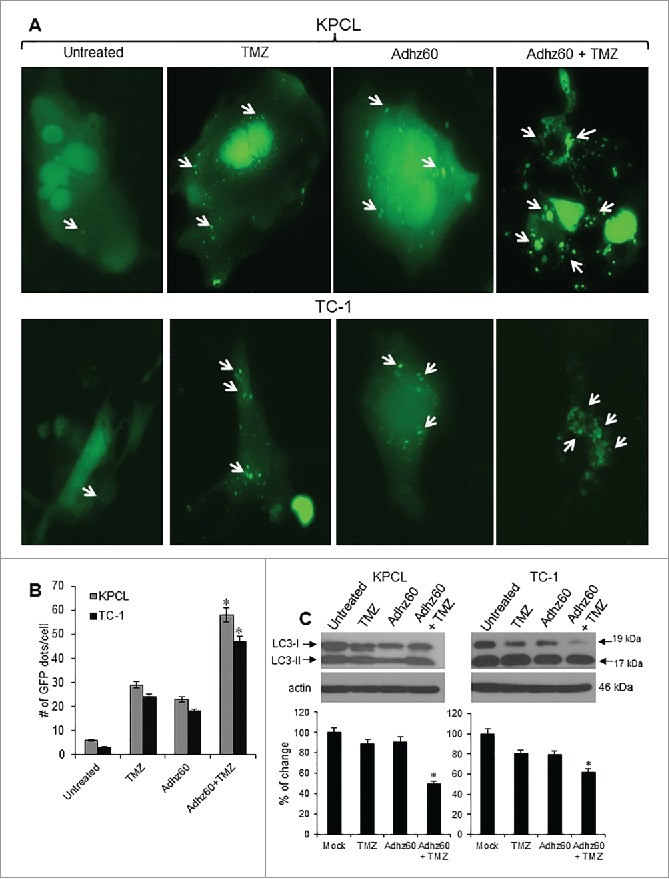
Figure 4.

Evaluation of combined therapy ability to induce autophagy in mouse cancer cells. (A) Murine cancer cells were transfected with pEGFP-LC3 followed by untreated or treated with TMZ at 400 µM or Adhz60 at an MOI concentration of 10 alone or in combination. Integration of GFP-LC3 into the autophagosome is depicted by punctate structures and was analyzed by fluorescence microscopy at 48h post-treatment. Images were taken at 40× magnification with the EVOS FL Imaging System (Advanced Microscopy Group) under 357/44 (nm) and 447/60 (nm) excitation and emission visualization. Comparison of number of GFP dots per cell in untreated cells or treated with TMZ, Adhz60 or combination of both. A representative experiment showing punctate (arrows) is shown from three performed. (B) Comparison of number of GFP dots per cell in untreated or treated cells with TMZ, Adhz60 or combination of both. A representative experiment is shown from three performed. (C)Whole cell protein lysates were collected 72h after indicated treatment. Western blot and bar graphs of LC3-I and II expressions. Bars represent mean ± SEM expressed as percentage of change from 3 separate experiments, (*P < 0.05) decrease in the level of LC3-I expression. Actin was used as a loading control.
