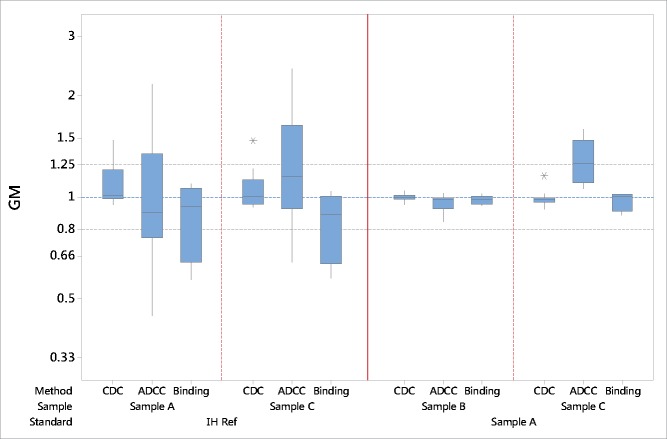
Figure 2.
Summary bioassay data of geometric mean (GM) relative potency estimates using “in house” reference (IH Ref) or the candidate (sample A) as a standard. Boxes represent the interquartile range and the line shows the median. The bars represent the range and * shows outliers defined as 1.5 times the interquartile range.

