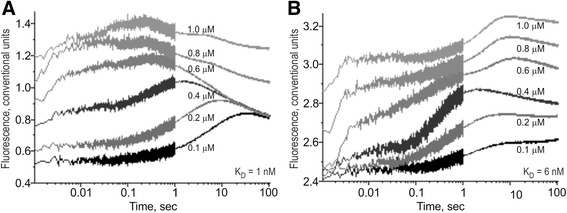
Fig. 3.

The kinetics of binding to and bending of the ODN corresponding to the selected SNP marker rs1800202. Legend: a The ancestral allele, ODN 5′-ctcTATATAAgtggg-3′. b The minor allele, ODN 5′-ctcTATAgAAgtggg-3′. ODN concentration was 0.1 μM. TBP concentration was between 0.1 and 1.0 μM as indicated near the corresponding curve of the time series. KD values, a 1 nM and b 6 nM, were obtained as the output of the Dynafit software (Biokin, USA) when we used the corresponding time-series data as input for this software
