
Fig. 7.
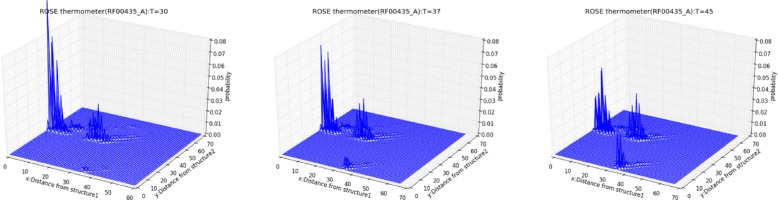
Distribution over Hamming distance (2D) of ROSE element thermometer, under the temperatures, 30 °C (left), (b) 37 °C (middle) and 45 °C (right). The first reference structure was obtained using the γ-centroid estimator (γ=1) with the Hamming distance [0,10] (Structure A, in Fig. 6). The second reference structure is obtained similarly from the Hamming distance [35,40] (Structure C, in Fig. 6)