Figure 2.

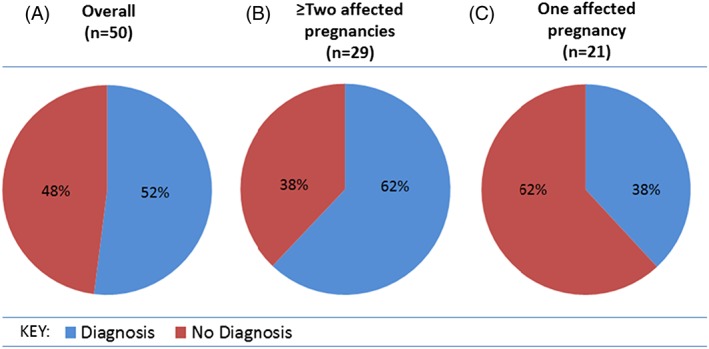
(A) The overall diagnostic yield in the 50 couples included in this audit. (b) The diagnostic yield for couples with 2 or more affected pregnancies. (C) The diagnostic yield for couples with a single affected pregnancy

(A) The overall diagnostic yield in the 50 couples included in this audit. (b) The diagnostic yield for couples with 2 or more affected pregnancies. (C) The diagnostic yield for couples with a single affected pregnancy