
Figure 5.
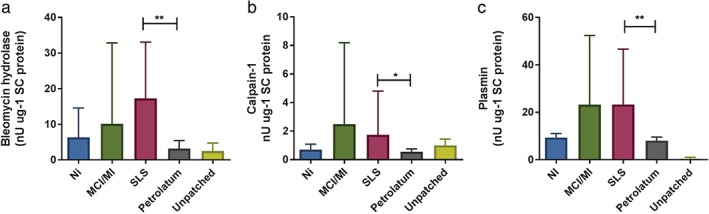
Activities of bleomycin hydrolase (a), calpain‐1 (b) and plasmin (c) in the stratum corneum samples of the skin sites tested with Ni (n = 4), methylchloroisothiazolinone (MCI)/methylisothiazolinone (MI) (n = 4), sodium lauryl sulfate (SLS) (n = 8) and their corresponding pet. controls (n = 8) and unpatched test sites (n = 8). Data for bleomycin hydrolase are shown as median with interquartile range; those for calpain‐1 (b) and plasmin (c) are shown as mean ± standard deviation. * p < 0.05, ** p < 0.01; (a) Wilcoxon signed rank test; (b, c), paired two‐sided t‐test).