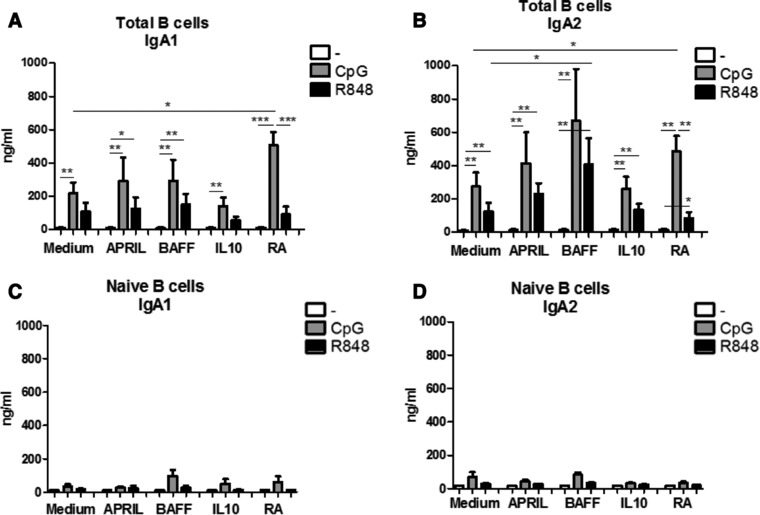
Figure 4.

BAFF and Retinoic acid differentially affect IgA1 and IgA2 production in mature stimulated B cells. IgA1 (A,C) and IgA2 (B,D) production by total peripheral blood (A,B) or naïve (C,D) B cells left unstimulated or stimulated for 6 days by CpG‐ODN or R848 in combination with T cell independent B cell class switch inducing factors as measured by IgA1 and IgA2 specific ELISA. Data shown as mean + SEM, A and B: n = 8–14 donors per group, combined graph of five separate experiments *p<0.05, **p<0.01, ***p<0.001 Mann–Whitney test, C and D: 3–5 donors per group, combined graph of two separate experiments *p<0.05, **p<0.01, ***p<0.001 Mann–Whitney test.
