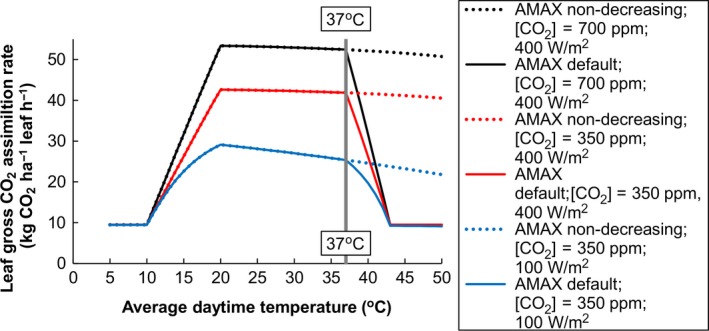
Figure 3.

Leaf gross assimilation as affected by various factors in the ORYZA2000 model. The solid lines show the default response curves in ORYZA2000 at 1.5 g N/m2 leaf area at two atmospheric CO 2 contents and two intercepted radiation levels. Average daytime temperature on the x‐axis is calculated as 0.75 × T max + 0.25 × T min. The default shows a sharp decline in assimilation above 37°C. The dashed lines (AMAX nondecreasing) show a scenario explored in the current paper to investigate if simulated yield declines were caused by decreasing AMAX above 37°C daytime temperature. The small minimum assimilation rate of 10 kg CO 2/ha leaf per hour below 10°C and above 43°C, is practically inconsequential
