Figure 1.

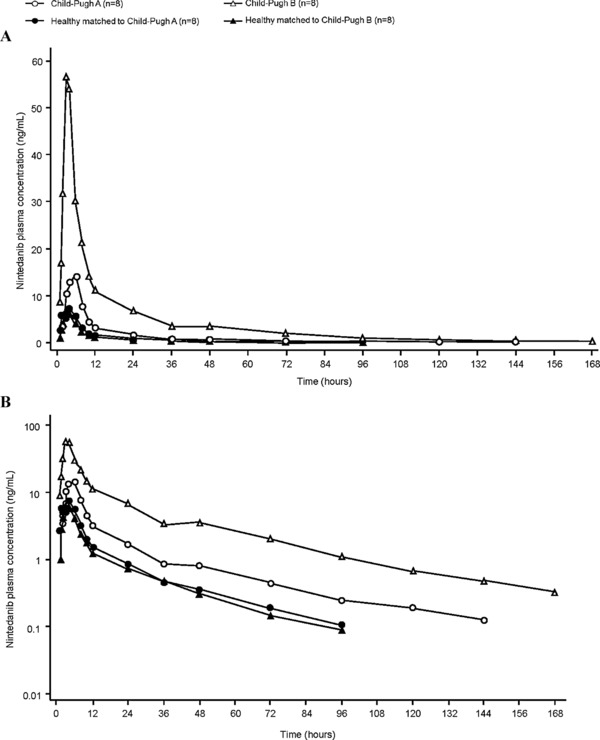
Geometric mean plasma concentration–time profiles of nintedanib after a single oral dose of nintedanib 100 mg in Child‐Pugh A and Child‐Pugh B subjects compared with healthy subjects: (a) linear scale; (b) semilog scale (PK set).

Geometric mean plasma concentration–time profiles of nintedanib after a single oral dose of nintedanib 100 mg in Child‐Pugh A and Child‐Pugh B subjects compared with healthy subjects: (a) linear scale; (b) semilog scale (PK set).