
Figure 7.
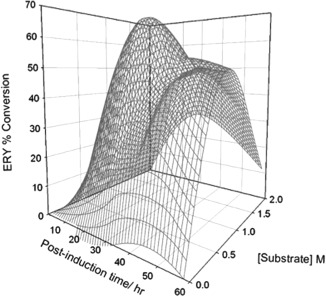
Response surface for TK150 strain whole cell biotransformation. Figure 6E data gathered for percentage conversion of substrates to l‐erythrulose (ERY) were plotted as a function of both the time post‐induction and the initial substrate concentration present in the reaction mixture. Average values were used to generate the response surface. Standard deviation among three biological repeats of the experiment is omitted for graphical brevity.