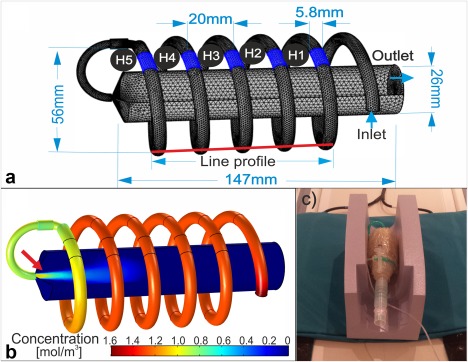
Figure 1.

(a) Simulation geometry of the gas‐flow phantom, including the line profile along the helix tube (red solid line), the syringe body, ROIs from H1 to H5, inlet and outlet boundaries, and tetrahedral mesh (minimum and maximum element sizes are 0.2 mm and 2.3 mm). (b) Corresponding concentration map of 129Xe, cXe (r,t), at a time point of 3.5 s post activation. (c) The gas‐flow phantom. Principle dimensions of the phantom are shown in (a). Arrow in (b) shows gas bulk flow effect.
