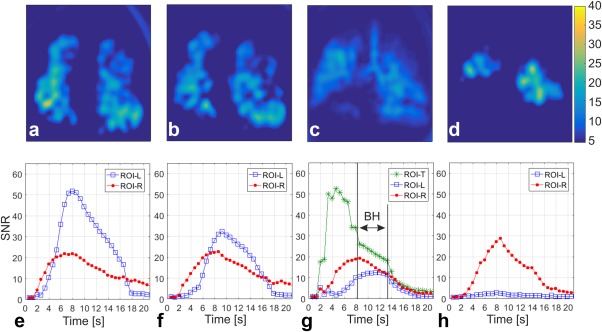
Figure 5.

Representative coronal DXeV images of the first COPD patient obtained with the N int = 2 spiral approach (a) slice 2, (b) slice 3, (c) average of slices 5, 6, and 7 for a full coverage of trachea, and (d) slice 9. Corresponding signal time curves of ROIs from the left lung (ROI‐L) and right lung (ROI‐R) as shown in (a) are also plotted from (e) to (h). ROI‐T stands for signal time curves of an ROI from trachea as shown in (c).
