
Figure 7.
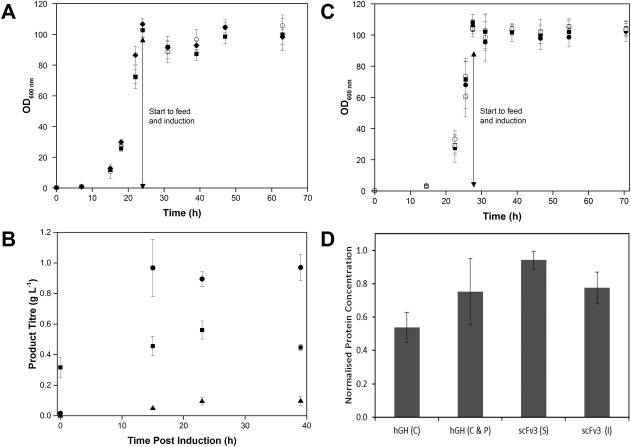
Screening of alternative strains and molecules in ambr 15f system.
A: Growth curves during fedbatch fermentations of E. coli MC4100 cells expressing scFv1 (○), scFv2 (▪) and scFv2* (filled diamonds) (n = 8). B: scFv1 concentration in the periplasm (●), cytoplasm (▪) and extracellular medium (filled triangles) determined by protein L HPLC at 0, 15, 23, and 39 h post induction at harvest (vessels quantified/analyzed: n = 2 for 0 and 23 h and n = 8 for 15 and 39 h). C: Growth curves during fed‐batch fermentations of E. coli BL21 (DE3) cells expressing scFv3 (S) (▪) scFv3 (I) (□) and hGH (C) (●) hGH (I & P) (○), n = 6 for each molecule. D: Normalised protein concentration at harvest (42 h postinduction) determined by IMAC HPLC, vessels quantified/analyzed: n = 6 for each molecule.