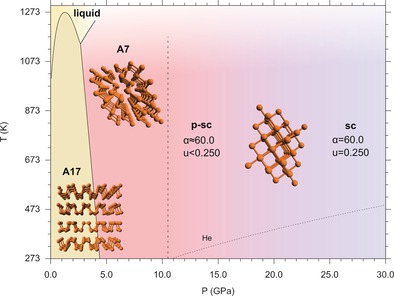
Figure 1.

Phase diagram of phosphorus between 0.0 and 30.0 GPa, showing the pressure and temperature ranges where A17 and A7 are reported to be stable.20, 29, 30 The dashed line at 10.5 GPa marks the A7 to sc phase transition according to current literature. Our room T data indicate that the sc phase is not achieved up to 27.6 GPa and that an intermediate pseudo simple‐cubic (p‐sc) structure exists between the A7 and the sc structures (see text). The melting line of He is also displayed (dotted line).31 The snapshots of the structures reported in the phase diagram were generated by Rietveld refinement of our data in the corresponding phases.
