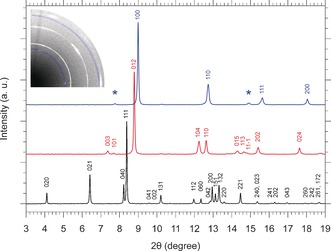
Figure 2.

XRD patterns of phosphorus at room temperature in the A17 phase at 0.2 GPa (lower black trace), in the A7 phase at 6.5 GPa (middle red trace) and in the sc phase at 11.2 GPa (upper blue trace) with the corresponding peak indexing. The peaks of the A7 phase have been indexed according to the hexagonal cell (see SI‐3). After background subtraction each pattern has been normalized to its most intense peak. The asterisks mark the two extra peaks not expected in the sc phase, which are highlighted by the blue‐shaded arcs in the image of the diffraction pattern (upper left).
