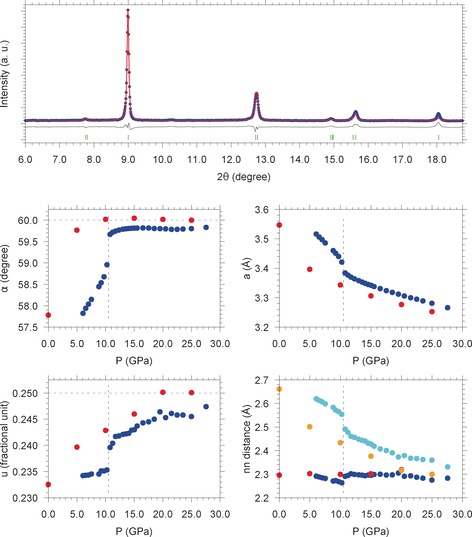
Figure 3.

Pressure evolution of the angle α (middle left panel), the fractional atomic position u (lower left panel), the lattice parameter a (middle right panel), and the nearest neighbor distances nn (lower right panel) across the A7 to sc phase transition of phosphorus obtained by Rietveld refinement. The blue points indicate the experimental data of this study, whereas the red points are the calculated values extracted from Ref. 38. In the case of nn the blue and cyan points, respectively indicate the experimental first (d 1) and second (d 2) nearest neighbor distances, whereas the red and orange points, respectively indicate the calculated38 first and second nearest neighbor distances. The dashed vertical line at 10.5 GPa represents the A7 to sc phase transition, reported in literature to occur sharply. The two dashed horizontal magenta lines at 60.0 degree (middle left panel) and at 0.250 fractional unit (lower left panel) indicate the limiting values of these quantities once the transition from the A7 to the sc phase is completed. In the upper panel an experimental XRD pattern acquired at 11.2 GPa (blue points), the corresponding Rietveld fit (red trace and green markers) and their difference (black trace) are shown.
