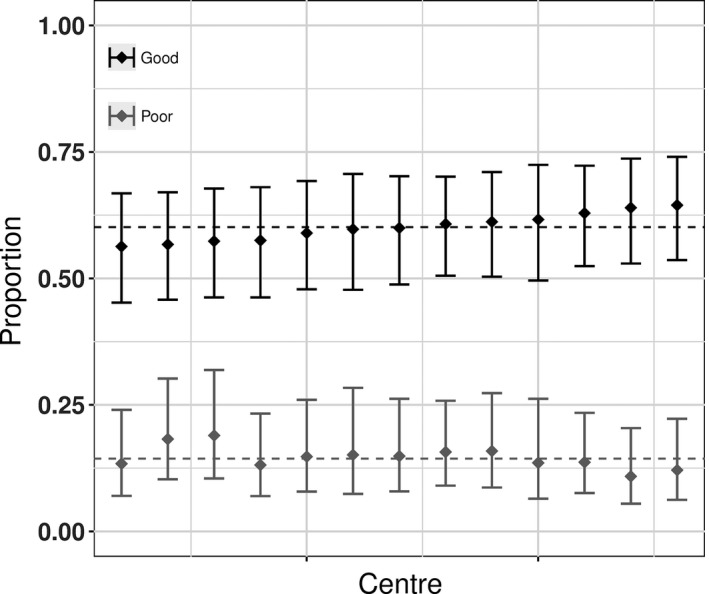
Figure 1.

Predicted proportion in each centre with a good outcome (black) and a poor outcome (grey) for dento‐alveolar relationship. The bars are 95% confidence intervals, and the dashed line is the predicted mean for the average centre adjusted for age and sex
