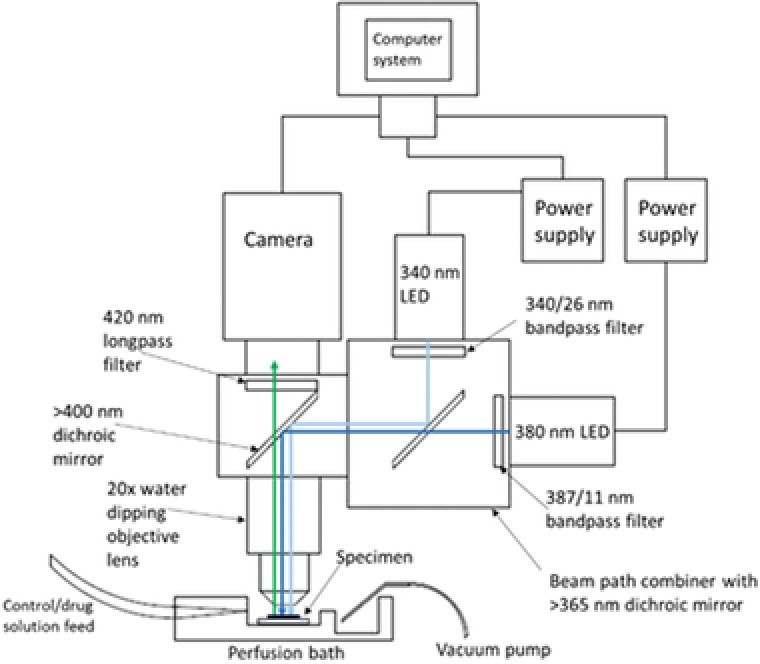
Figure 3.

Schematic diagram of experimental imaging setup showing the location of the specimen in relation to the objective lens and where the perfused solution flows over the specimen and gets removed from the bath. The light paths of the 340/380 nm LEDs are also shown to converge through the use of 365 nm dichroic mirror and then illuminate the specimen in the perfusion bath sequentially. The emitted Fura‐2 AM fluorescence propagates upwards through the objective lens, >400 nm dichroic mirror (Olympus) and 420 longpass filter (Olympus) to the camera. The camera and power supplies for both LEDs are connected to a computer system for TTL triggering and recording fluorescent signals.
