Figure 4.

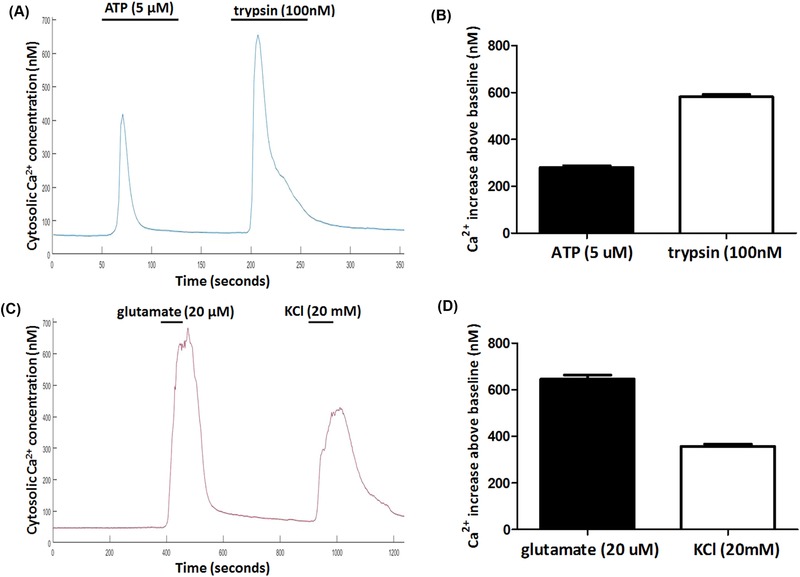
(A) Representative trace of Ca2+ changes in tsA‐201 cells (n = 572) elicited by the application of ATP (5 M) and trypsin (100 nM). (B) Average pharmacologically stimulated Ca2+ increases above the baseline levels in tsA‐201 cells. (C) Representative trace of Ca2+ increase in hippocampal neurons (n = 388) through the application of glutamate (20 M) and KCl (20 mM). (D) Average Ca2+ increases above resting levels in hippocampal neurons for each stimulus.
