Figure 5.

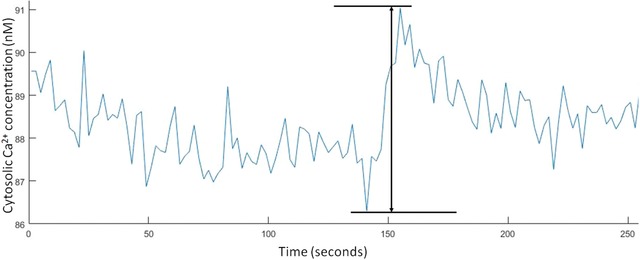
Example plot of the peak‐to‐peak noise recorded in the hippocampal neurons baseline Ca2+ concentrations while carrying out 0.5 Hz ratiometric Fura‐2 Ca2+imaging.

Example plot of the peak‐to‐peak noise recorded in the hippocampal neurons baseline Ca2+ concentrations while carrying out 0.5 Hz ratiometric Fura‐2 Ca2+imaging.