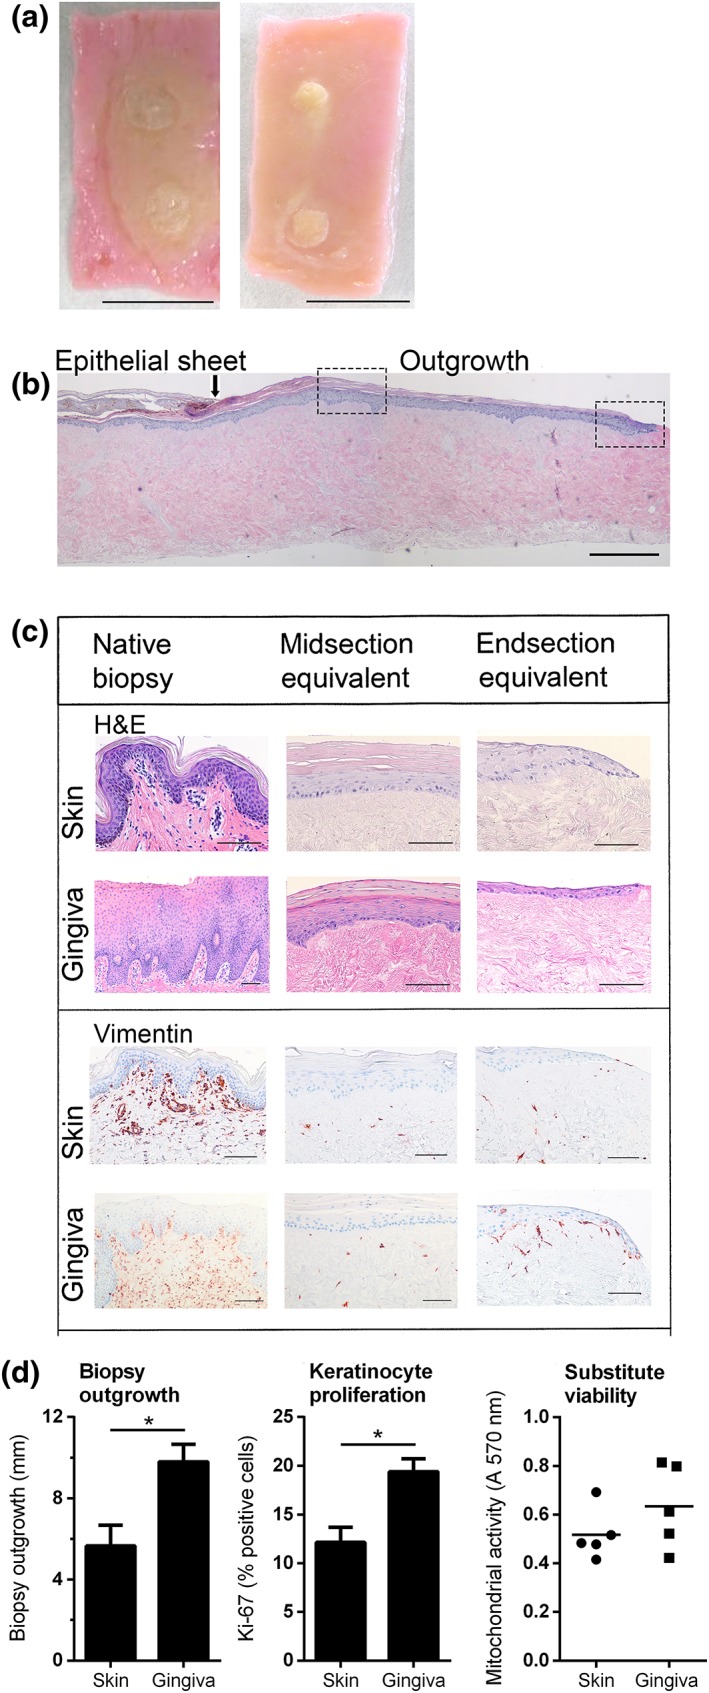
Figure 2.

Gingiva substitutes show enhanced epithelial outgrowth and proliferation compared with skin substitutes. (A) representative macroscopic view of a skin substitute (left) and a gingiva substitute (right) at the time of harvesting after 3 weeks of culturing. Scale bar = 1 cm. (B) representative microscopic image. The original epithelial sheet of the biopsy and the outgrowing epithelial tissue of a skin substitute are shown with haematoxylin and eosin (H&E) staining. The arrow indicates the end of the epithelial sheet of the biopsy and the beginning of the epithelial outgrowth). The left box indicates the location of the ‘midsection’ in Figure 2C; the right box indicates the ‘end section'. Scale bar = 0.5 mm. (C) Representative H&E and vimentin staining is shown for native tissue, the midsection of the substitute as well as the migrating front of the substitute (end section). The skin substitute represents orthokeratinized epithelium, whereas the gingiva substitute represents parakeratinized epithelium. Scale bar = 100 μm. (D) extent of outgrowth from the epithelial sheet of the biopsy (left), percentage of Ki‐67‐positive keratinocytes (middle) and cell viability as determined by MTT assay (right) is shown for skin substitutes and gingiva substitutes. An absorbance above 0.05 indicates mitochondrial activity and cell viability. Bars represent means ± standard error of the mean of n = 6 skin donors for skin substitutes and n = 5 gingiva donors for gingival substitutes. *p < 0.05, **p < 0.01
