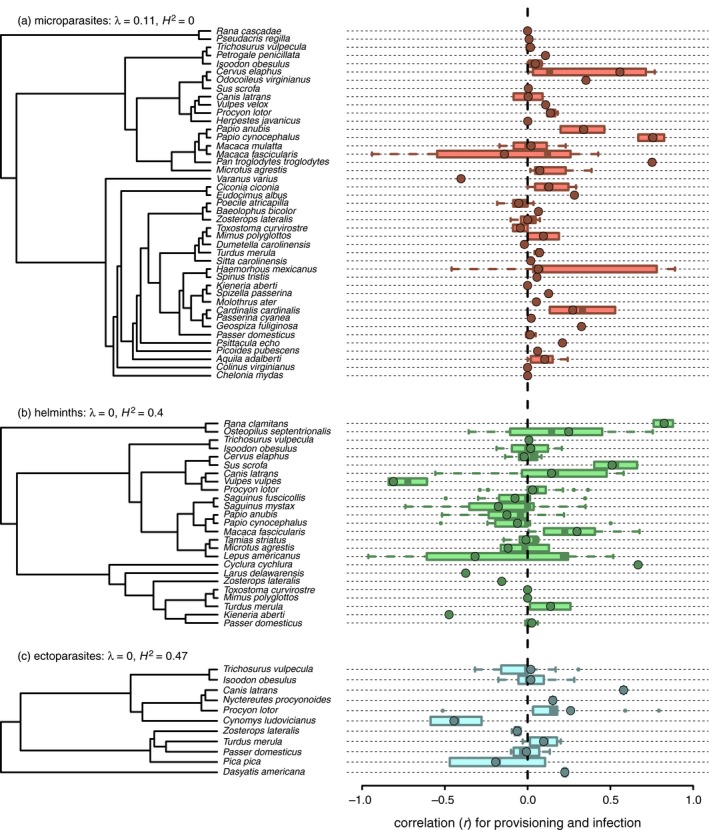
Figure 2.

Phylogenetic visualization of infection outcomes of resource provisioning for microparasites (a), helminths (b) and ectoparasites (c). Boxplots show the median and first and third quartile of effect sizes (back‐transformed r), whiskers show the range of non‐outliers and open circles show potential outliers. Filled circles display the weighted mean effect sizes per host species. Legends display estimates of Pagel's λ and phylogenetic heritability (H 2) in effect sizes
