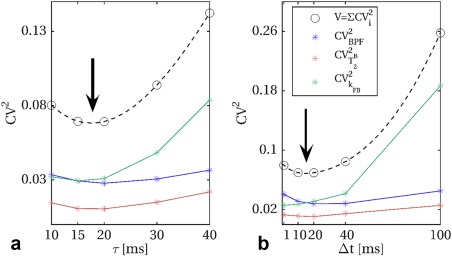
Figure 3.

Heuristic search for optimal pulse duration (τ) and pulse gap (Δt), at optimal train length N opt = 25. Optimal cost function V values for different τ at fixed Δt = 20 ms, and different Δt at fixed τ = 20 ms are shown in (a) and (b), respectively. Spline interpolation between tested configuration is added to the graph (dashed lines), to guide the choice of τopt and Δt opt. The individual contribution of each parameter to the cost function, given by the square of the theoretical CV (obtained from CRLB), is also shown for BPF (blue), (orange), and k FB (green). Arrows indicate approximate location of minimal value of V as function of the inspected parameters.
