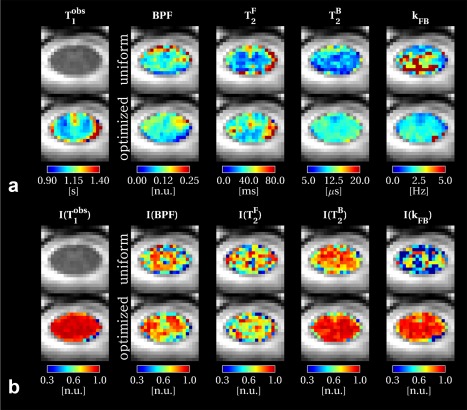
Figure 5.

Spinal cord quantitative maps in an example slice. qMT parameter maps are shown in (a) both for uniform (top row) and optimized (bottom row) protocols, together with the shared T1 maps estimated from the Inversion Recovery protocol. For the same slice, reproducibility indices I of model parameters are shown in (b). Reproducibility index I for a given parameter p is calculated from the three repeated acquisition using Eq. (5) and ranges between [0,1] (the higher, the more reproducible the metric is). More examples of qMT parameter maps and reproducibility indices I are given in Supporting Figures S5 and S6.
