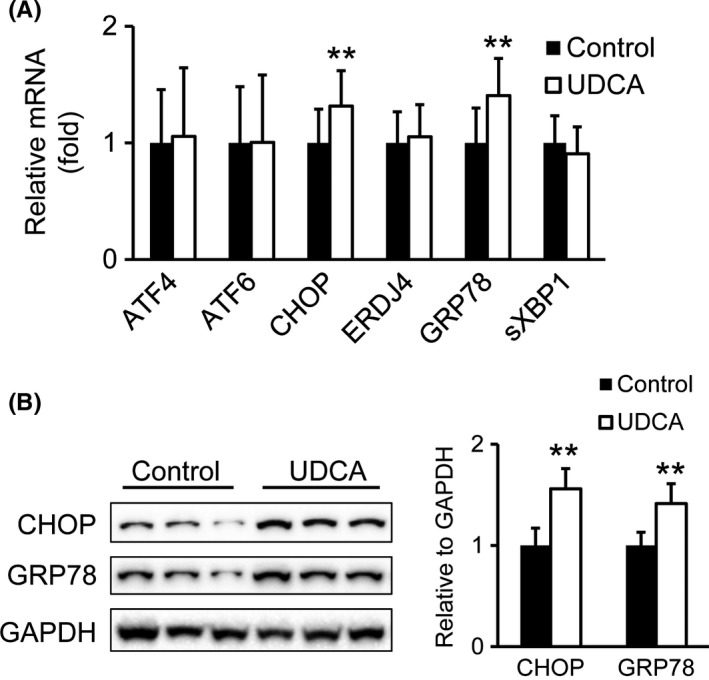
Figure 2.

UDCA induces hepatic ER stress markers. (A) mRNA analysis of hepatic ER stress markers. Control: n = 18; UDCA: n = 19. (B) Protein levels of CHOP and GRP78. Representative Western blots are shown. Signal intensities were normalized to GAPDH. Control: n = 7; UDCA: n = 6. Mean values ± SD are expressed for all data. **P ≤ .01 vs control group
