Figure 6.

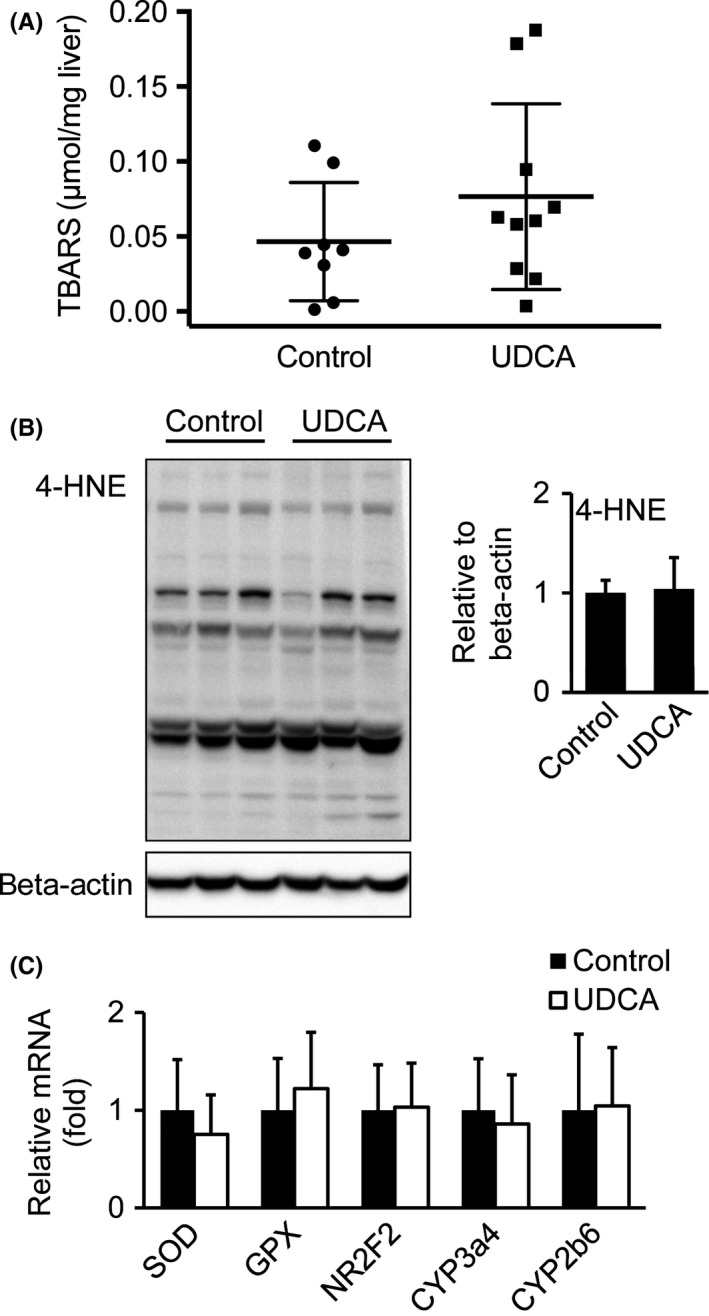
Oxidative stress levels remain unchanged after UDCA treatment. (A) Thiobarbituric acid reactive substances (TBARS) levels were measured from liver homogenates by TBA assay as an indicator for lipid peroxidation. Control: n = 8; UDCA: n = 10. (B) Immunoblotting of 4‐HNE‐conjugated protein levels. Signal intensities were normalized to beta‐actin. Control: n = 7; UDCA: n = 6. (C) Hepatic mRNA expression of enzymes (SOD, GPX, CYP3a4, CYP2b6) and transcription factor (NR2F2) as oxidative stress indicators. Control: n = 18; UDCA: n = 19. Mean values ± SD are expressed for all data
