
Figure 1.
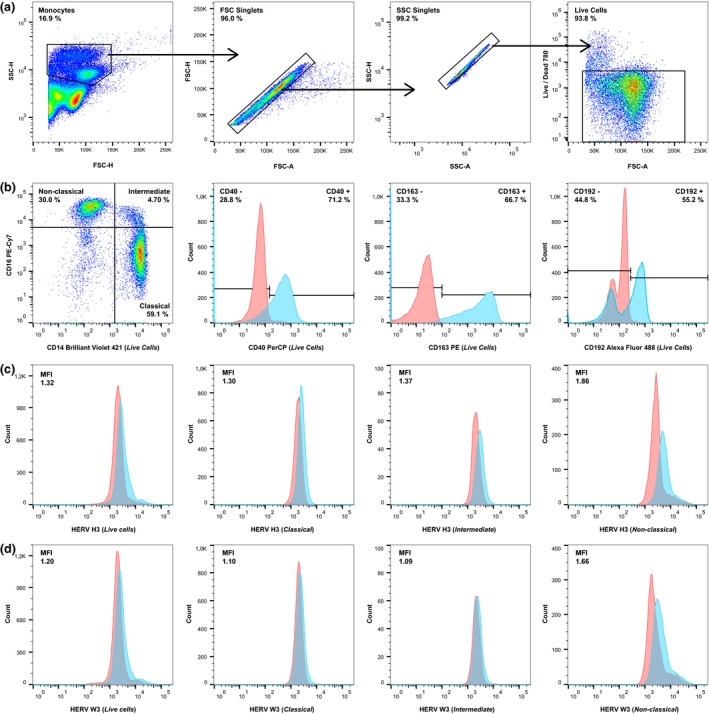
Gating strategy used in the flow cytometric analysis of patient and healthy control samples. A sample from a representative patient with RRMS was used for this figure. (a) From left to right: Total monocytes (> 20,000 events) were gated according to their size and granularity in forward scatter‐height (FSC‐H)/side scatter‐height (SSC‐H), aggregated cells were removed according to forward scatter‐area (FSC‐A)/FSC‐H and side scatter‐area (SSC‐A)/SSC‐H, and finally dead cells were removed according to staining with a LIVE/DEAD ® cell stain. (b) From left to right: The tree monocyte subsets (classical, intermediate, nonclassical) were gated on the “Live Cells” gate, as were the CD40+, CD163+, and CD192+ cells (blue). Appropriate isotype controls (red) were used to determine the unspecific antibody binding. (c, d) From left to right: Human endogenous retrovirus (HERV) expression was determined on the total monocyte population (Live cells) and the three monocyte subsets (classical, intermediate, nonclassical) by incubation with sera from rabbits immunized with HERV H3 Env (c) or HERV W3 Env (d) peptide antigens (blue) as described previously36 and with the appropriate control (pre‐immune sera) (red) to determine the median fluorescence index (MFI).