
Figure 2.
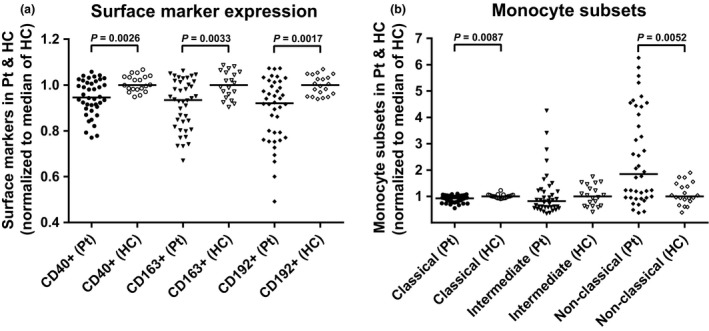
Differences in the expression of CD40, CD163, CD192, and of the three monocyte subsets in the patient group normalised to the median of the healthy controls. The differences in expression of CD40, CD163, and CD192 on the total monocyte population (Live cells, Figure 1) (a) and the three monocyte sub‐populations; classical, intermediate, and nonclassical (b) were determined as % positive cells of the monocytes, divided by the respective median levels of the healthy control samples to give the fold change. Bars represent the median of the populations and braces indicate a significant difference (Mann–Whitney U‐test) between the median of the patient group (n = 40) and the median of the healthy control group (n = 20). P‐values are listed. Pt, patients; HC, healthy controls.