
Figure 4.
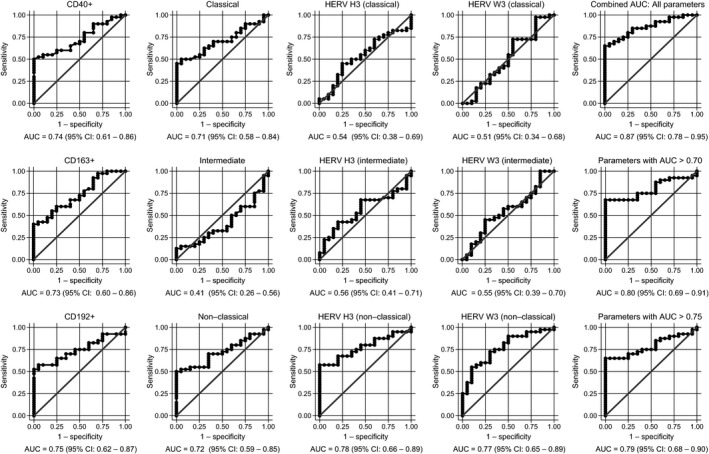
Logistic regression analyses with ROC curve output of patients with CIS or MS plotted against the HC group. AUC, with 95% CI, is given for each parameter. The surface expression of each parameter for patients with CIS or MS (n = 40) are combined as true positives and plotted against HC as true negatives (n = 20). The diagonal dividing the ROC space represents the random event. A logistic regression analysis with combined parameter results has been performed for “all parameters”, parameters with AUC > 0.70, and AUC > 0.75. ROC, receiver operating characteristic; AUC, Area under the curve; RRMS, relapsing‐remitting MS; PPMS, primary‐progressive MS; CIS, clinically isolated syndrome; HCs,healthy controls.