
Figure 2.
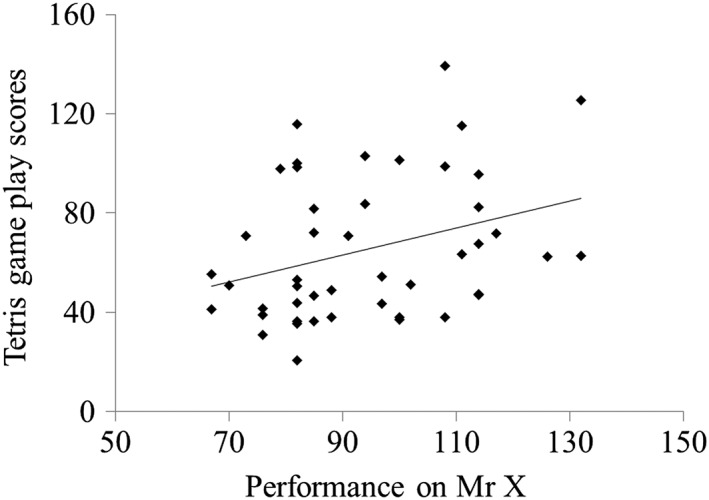
Scatterplot depicting the correlation between performance on Mr X and Tetris game play scores (r = .33, p = .028); Tetris game play scores were square root transformed; and standard performance scores were derived for Mr X (M = 100, SD = 15)