Figure 2.

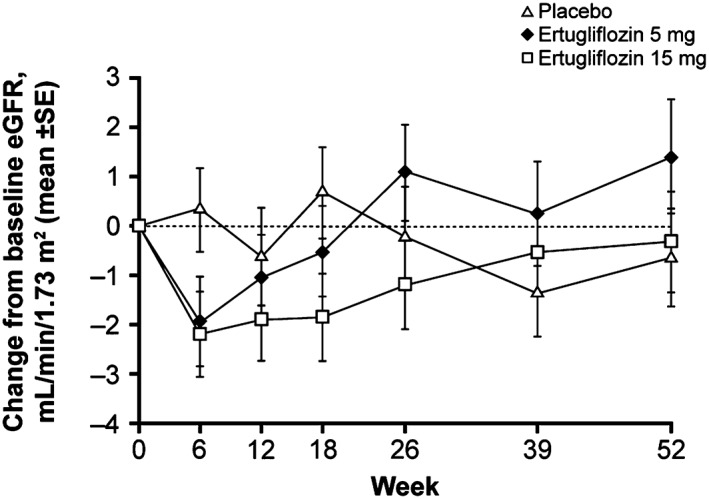
Mean change from baseline in estimated glomerular filtration rate (eGFR) (mL/min/1.73 m2) through Week 52. SE, standard error

Mean change from baseline in estimated glomerular filtration rate (eGFR) (mL/min/1.73 m2) through Week 52. SE, standard error