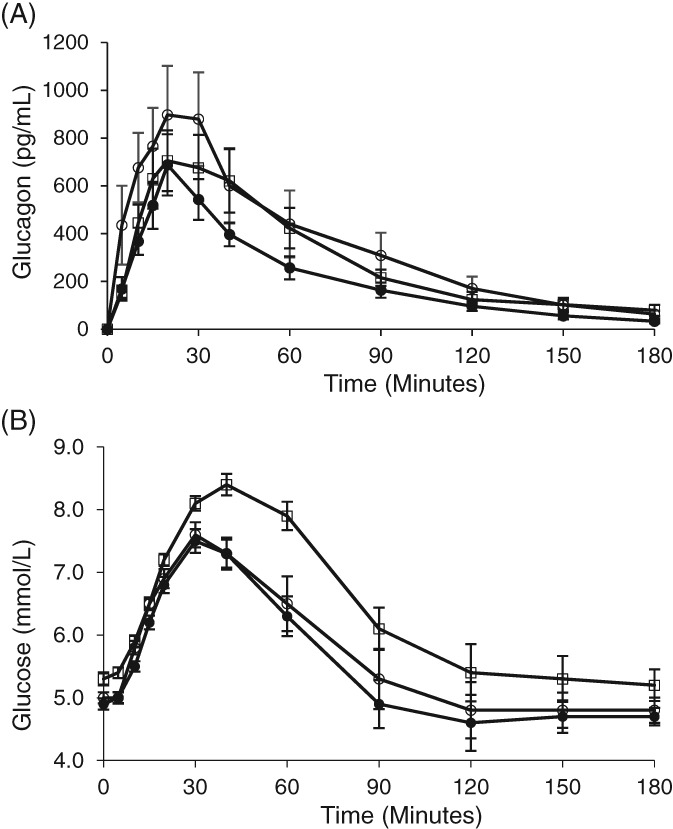
Figure 2.

Glucagon and glucose concentrations over time following nasal glucagon administration. A single 3‐mg dose of nasal glucagon was administered at time 0. Glucagon concentrations are shown in Panel A. Glucose concentrations are shown in Panel B. White circles = Cohort 1 NG with nasal congestion. Black circles = Cohort 1 NG without cold symptoms. White squares = Cohort 2 (NG with nasal congestion, treated with decongestant). Values are given as means (adjusted for baseline concentration) ± standard error; NG = nasal glucagon; 1 mmol/L = 18 mg/dL
