Figure 1.

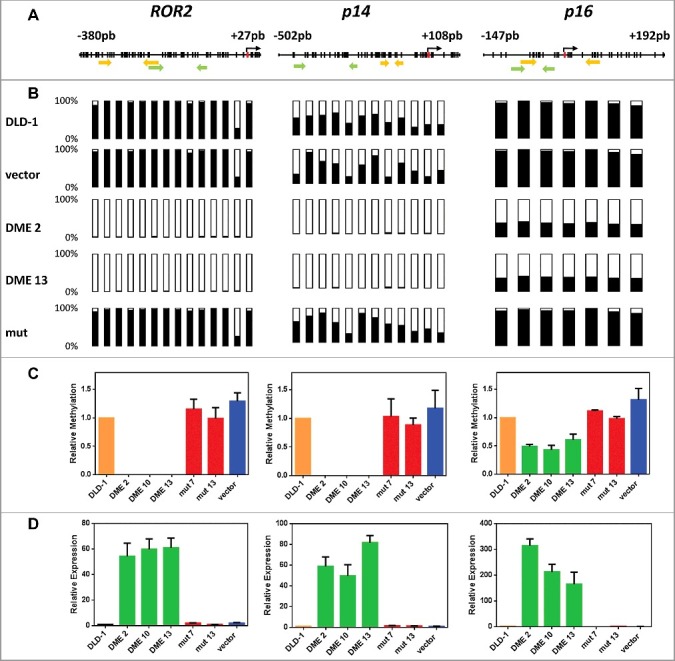
DNA demethylation of ROR2, p14, and p16 in DME-expressing cells is accompanied by gene reactivation. (A) Schematic diagram of analyzed genes. Each vertical bar represents a CpG dinucleotide. Position of ATG codon is indicated as a red rectangle. Green arrows show the location of pyrosequencing primers and yellow arrows the location of qMSP primers. (B) Methylation levels analyzed by bisulfite pyrosequencing; CpG sites are shown as bars filled with black to represent percentage methylation. (C) Methylation levels analyzed by qMSP (D) Gene expression levels analyzed by qRT-PCR. Analyses were performed in non-transfected DLD-1 cells and independent transfectants expressing WT DME (DME 2, DME 10, and DME 13), a catalytically inactive mutant version (mut 7 and mut 13) or cells transfected with the empty vector. Values are shown relative to those detected in non-transfected cells. Data are the mean ± SE of three independent experiments.
