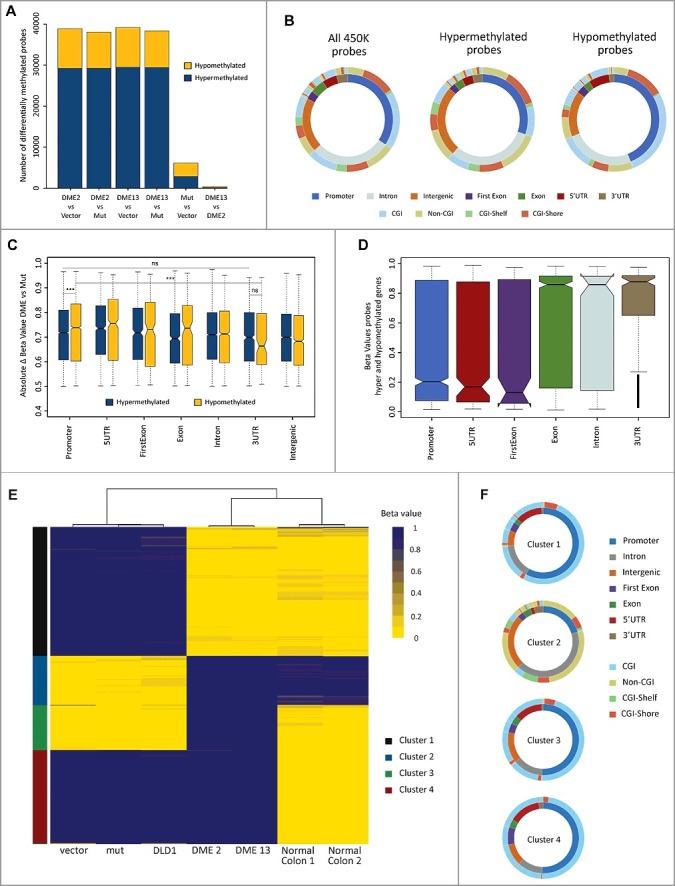
Figure 4.

DME expression causes both losses and gains of DNA methylation, partially restoring the pattern of normal tissue. (A) Barplot depicting the number of CpG sites displaying differential methylation in several pairwise comparisons. Cell lines are DLD-1 cells transfected with the empty vector and transfectants expressing WT DME or a mutant version. Hyper-/hypo-methylation indicates a statistically significant methylation increase/decrease observed in the first member of each pair. (B) Distribution of differentially methylated CpG sites according to their genomic location (inner ring) and CpG class (outer ring). The left plot represents the distribution of all probes in the 450K methylation array. Center and right plots depict sites displaying hyper- or hypo-methylation in both DME 2 and DME 13 lines when compared to cells expressing a mutant DME version. Colors indicate the percentage of sites at each location, as indicated at the bottom. (C) Overall methylation changes in CpG sites displaying differential methylation according to their respective genomic locations. Absolute beta values are means for sites displaying hyper- or hypo-methylation in both DME 2 and DME 13 lines when compared to cells expressing a mutant DME version. (D) Boxplot indicating overall changes in beta values across different genomic locations for probes located in genes containing both hyper- and hypo-methylated sites. Values are means for sites displaying hyper-or hypomethylation in both DME 2 and DME 13 lines when compared to cells expressing a mutant DME version. (E) Heatmap representing the methylation status (beta-value) of the 3000 most variable probes (y-axis) for each of the different cell samples (x-axis). Unsupervised clustering analysis grouped cell samples in 3 main clusters (indicated by three major branches of the upper dendrogram) and CpG sites in 4 main groups (indicated on the left by different colors, see text for details). (F) Genomic location and CpG class distribution for each of the 4 groups of CpG sites identified by the unsupervised clustering algorithm.
