Figure 5.

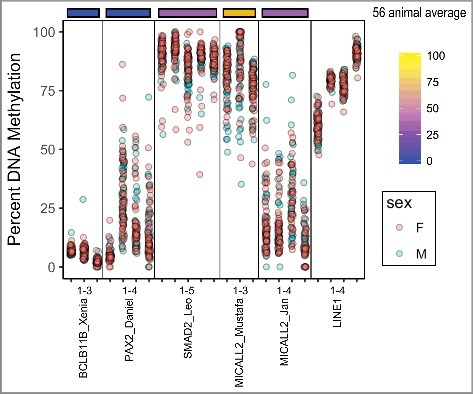
DNA Methylation of UCNEs in a Human population. 5 UCNEs are shown in comparison to the 56 animal average (top). LINE1 element methylation is shown (right). UCNEs are listed in order of decreasing CpG density.

DNA Methylation of UCNEs in a Human population. 5 UCNEs are shown in comparison to the 56 animal average (top). LINE1 element methylation is shown (right). UCNEs are listed in order of decreasing CpG density.