Figure 5.

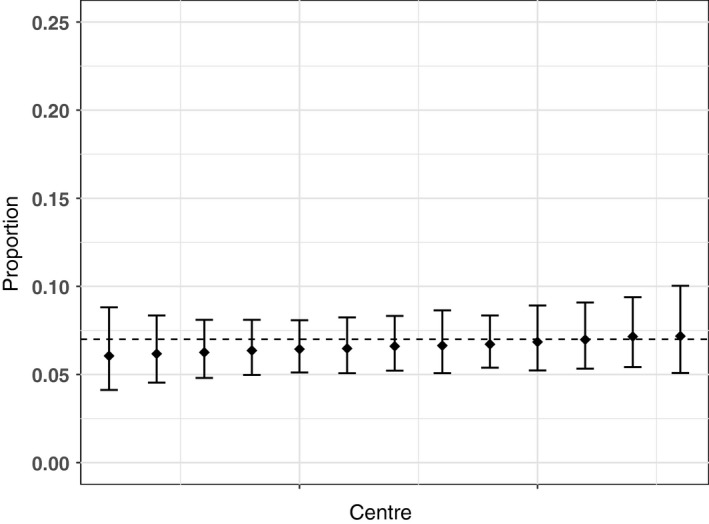
Predicted proportion of children with very low prosocial problems in each centre. The bars are 95% confidence intervals, and the dashed line is the predicted mean for the average centre. All results are adjusted for age and sex

Predicted proportion of children with very low prosocial problems in each centre. The bars are 95% confidence intervals, and the dashed line is the predicted mean for the average centre. All results are adjusted for age and sex